The headline number, and what sits behind it
On 20 November 2025, the Health and Safety Executive published its annual workplace health and safety statistics for the 2024/25 reporting year. The figure that caught most of the coverage was the one that should catch it: an estimated 680,000 workers sustained a non-fatal injury at work in Great Britain, based on self-reports to the Labour Force Survey. That is up from 604,000 in 2023/24, an increase of 76,000 injuries, or about 13% year-on-year.
Behind the headline, the picture is more textured than the number alone suggests. The increase was concentrated in shorter-duration injuries rather than the most severe: injuries resulting in up to 7 days absence rose by around 17% to 556,000, while injuries resulting in more than 7 days absence sat broadly flat at 124,000. Alongside those non-fatal figures, 124 workers were killed in work-related accidents in 2024/25. The total economic cost of workplace injury and ill health, in the latest HSE estimate, stands at £22.9 billion a year.
Why HSE themselves are calling this a plateau
The more important signal in the 2024/25 release is not the single-year jump. It is what HSE say about the underlying trend. The self-reported non-fatal injury rate is now approximately 2,070 injuries per 100,000 workers, which sits roughly in line with the 2018/19 pre-pandemic level. In HSE’s own framing, “the long-term reduction in the overall risk faced by workers has not continued”.
That is worth reading twice. For most of the last two decades, the British workplace has been getting measurably safer year on year. The approaches that got us there, risk-assessment-led management, engineering controls, training, reporting, have not suddenly stopped working. But they have stopped moving the number. If you are an operations leader, that is the signal to look at what has not changed in your safety stack.
Where the injuries are actually happening
The top causes of RIDDOR-reportable non-fatal injuries in 2024/25 look remarkably similar to every year for the last decade:
- •Slips, trips or falls on the same level: 30% of reported injuries.
- •Handling, lifting or carrying: 17%.
- •Struck by a moving object: 10%.
- •Acts of violence: 10%.
- •Falls from a height: 8%.
Two observations worth making. First, the dominant categories are overwhelmingly situational: a person in the wrong place, something moving that shouldn’t be, two things occupying the same space at the same time. They are, in principle, the kinds of events an attentive observer could see coming a few seconds before they happened.
Second, for the first time in the recent record, Accommodation and Food Service Activities has the highest rate of workplace non-fatal injuries, overtaking Construction. That is a reminder that “industrial safety” is not only heavy industry. High-throughput, high-interaction environments of all kinds are exposed.
Why the tools that got us here cannot, on their own, move the number further
HSE’s own research into human factors is blunt: human failure contributes to almost all workplace accidents and hazardous exposures. Across occupational safety studies more broadly, human factors are typically cited as involved in 70 to 90% of incidents. That is not an argument for blaming workers. It is an argument that the work environment and the supporting systems have to do more of the heavy lifting, because people, even well-trained, well-intentioned people, will continue to have lapses, distractions and moments of misjudgement.
Most of the tooling deployed alongside the traditional safety hierarchy is fundamentally passive. CCTV records what happened. Supervision can only be in one place at a time. Signage and PPE depend on consistent human compliance. Near-miss reporting depends on the event being recognised, remembered and written up. All of these matter, and none of them close the loop between noticing a hazard and doing something about it before an injury occurs.
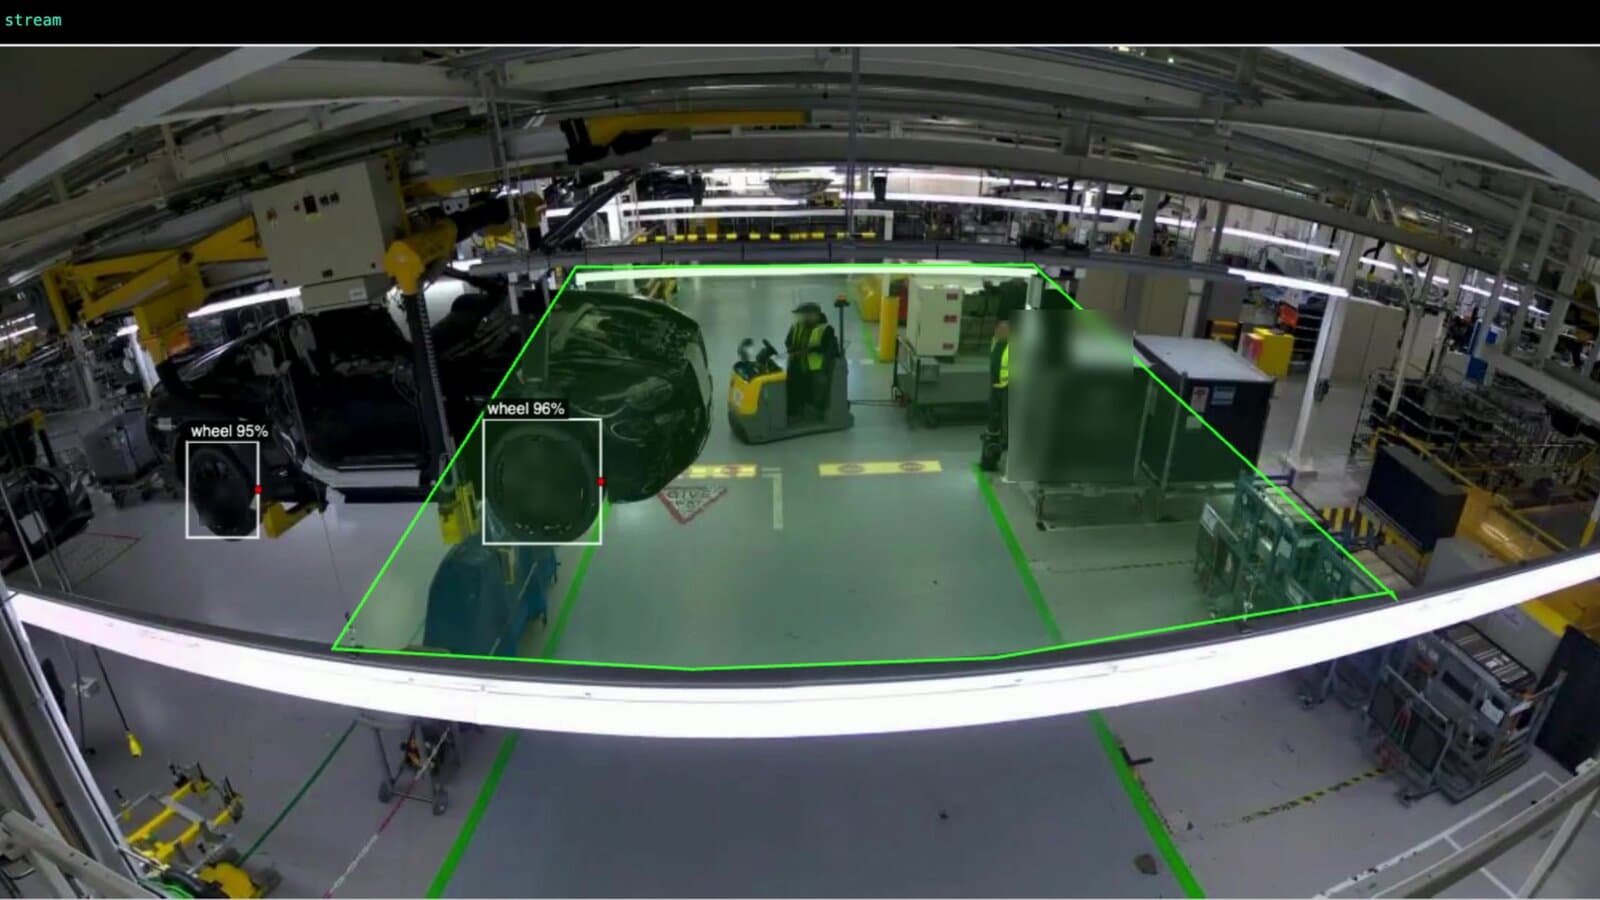
What an active approach looks like in practice
The category gap worth naming is between systems that observe and systems that act. An active safety system detects a situation developing, evaluates it against a rule, and physically intervenes in the world, a barrier closes, a vehicle is throttled, a warning is triggered, a relay opens, all inside a time budget short enough to change the outcome. Anything slower is, by definition, evidence rather than prevention.
What that implies for a vision-based safety system is concrete:
- •End-to-end latency measured from pixel to physical output, on site rather than in a lab.
- •Direct integration with existing safety control infrastructure, so the action is a command the site already understands.
- •Deterministic, offline-capable behaviour so the system does not stop at the first connectivity hiccup.
- •Continuous operation, so the system does not rely on somebody being present to observe.
- •Auditable action records that show the specific events the system prevented or flagged, without turning the workplace into a surveillance estate.
Each of those points is worth an article on its own. We have covered latency in “Why 150 ms decides whether a safety system is active or advisory”, connectivity in “Offline-first by design”, and the privacy question in “Safety AI is not surveillance”.
Where technology fits in the hierarchy of control
None of the above replaces the safety hierarchy. Elimination, substitution, engineering controls, administrative controls and PPE, in that order, are still the right framework. Training, culture and the design of work still do the heavy lifting. Technology belongs inside that hierarchy, most naturally at the engineering-controls layer, as an active safeguard that supplements, rather than replaces, a competent risk assessment.
The practical question for H&S managers and operations leaders in 2026 is whether the safety stack on site is doing everything it reasonably could, given what the data now shows. If the long-run reduction has genuinely plateaued on conventional tooling, then layering an active, vision-based safeguard onto the highest-risk interactions, vehicle versus pedestrian, access to energised machinery, zone violations during active work, is one of the few realistic levers left.
Where we sit on this
We built SAiFI because we looked at the same numbers and drew the same conclusion. Active, sub-150 ms, vision-based safety that runs at the edge, integrates with existing control infrastructure, works offline, and produces the audit evidence regulators and insurers want without turning the workplace into a surveillance estate.
If the HSE figures are prompting a hard look at your current stack, our team would be glad to walk you through what a deployment looks like on a real site, and what it would take to move your own numbers.
Sources & references
- Key figures for Great Britain 2024 to 2025 · Health and Safety ExecutivePrimary source for the 680,000 non-fatal injuries, 124 fatalities, 1.9 million workers with work-related ill health, 40.1 million working days lost, and £22.9 billion economic cost figures.
- Non-fatal injuries at work in Great Britain · Health and Safety ExecutiveBreakdown of injuries by duration (556,000 up to 7 days / 124,000 over 7 days), self-reported rate of roughly 2,070 per 100,000 workers, and the HSE statement that the long-term reduction in risk has not continued. Also the source of the top-cause percentages (slips/trips/falls 30%, handling/lifting 17%, struck by moving object 10%, acts of violence 10%, falls from a height 8%).
- HSE publishes annual workplace health and safety statistics · HSE Media Centre · 20 November 2025Official publication date of the 2024/25 annual statistics release.
- Health and Safety statistics: 2024 to 2025 annual release · GOV.UKGOV.UK mirror of the 2024/25 annual release and underlying data tables.
- Managing human failures: overview · Health and Safety ExecutiveSource for the statement that human failure contributes to almost all workplace accidents and hazardous exposures.
- Human errors · Health and Safety ExecutiveSupporting reference on HSE’s classification of human errors (slips, lapses, mistakes) and violations.